Specify replicate-specific covariate dependence in models of population dynamics
Source:R/replicated_covariates.R
replicated_covariates.RdSpecify relationship between a vector or matrix of covariates
and vital rates, but with a different covariate value for each replicate
(i.e., each value of nsim in simulate)
Arguments
- masks
a logical matrix or vector (or list of these) defining cells affected by
funs. See Details andmasks- funs
a function or list of functions with one element for each element of
masks. See Details
Value
replicated_covariates object specifying replicate-specific
covariate effects on a matrix population model; for use with
dynamics
Details
Masks must be of the same dimension as the population
dynamics matrix and specify cells influenced by covariates
according to funs. Additional details on masks are
provided in masks.
Functions must take at least one argument, a vector or matrix representing the masked elements of the population dynamics matrix. Incorporating covariate values requires a second argument. Functions must return a vector or matrix with the same dimensions as the input, modified to reflect the effects of covariates on vital rates.
Additional arguments to functions are supported and can be
passed to simulate with the args
argument.
format_covariates is a helper function
that takes covariates and auxiliary values as inputs and
returns a correctly formatted list that can be passed
as args to simulate.
replicated_covariates operates identically to
covariates except that it allows for a different
value of the covariate applied to each replicate trajectory. This
specification can incorporate complex structures, such as temporal
dynamics in environmental stochasticity and correlated uncertainty
in vital rates.
Examples
# define a population matrix (columns move to rows)
nclass <- 5
popmat <- matrix(0, nrow = nclass, ncol = nclass)
popmat[reproduction(popmat, dims = 4:5)] <- c(10, 20)
popmat[transition(popmat)] <- c(0.25, 0.3, 0.5, 0.65)
# define a dynamics object
dyn <- dynamics(popmat)
# can add covariates that influence vital rates
# e.g., a logistic function
covars <- replicated_covariates(
masks = transition(popmat),
funs = \(mat, x) mat * (1 / (1 + exp(-10 * x)))
)
# simulate 50 random covariate values for each replicate (each
# value of nsim, set to 100 below)
xvals <- matrix(runif(50 * 100), ncol = 100)
# update the dynamics object and simulate from it.
# Note that ntime is now captured in the 50 values
# of xvals, assuming we pass xvals as an argument
# to the covariates functions
dyn <- update(dyn, covars)
sims <- simulate(
dyn,
init = c(50, 20, 10, 10, 5),
nsim = 100,
args = list(
replicated_covariates = format_covariates(xvals)
)
)
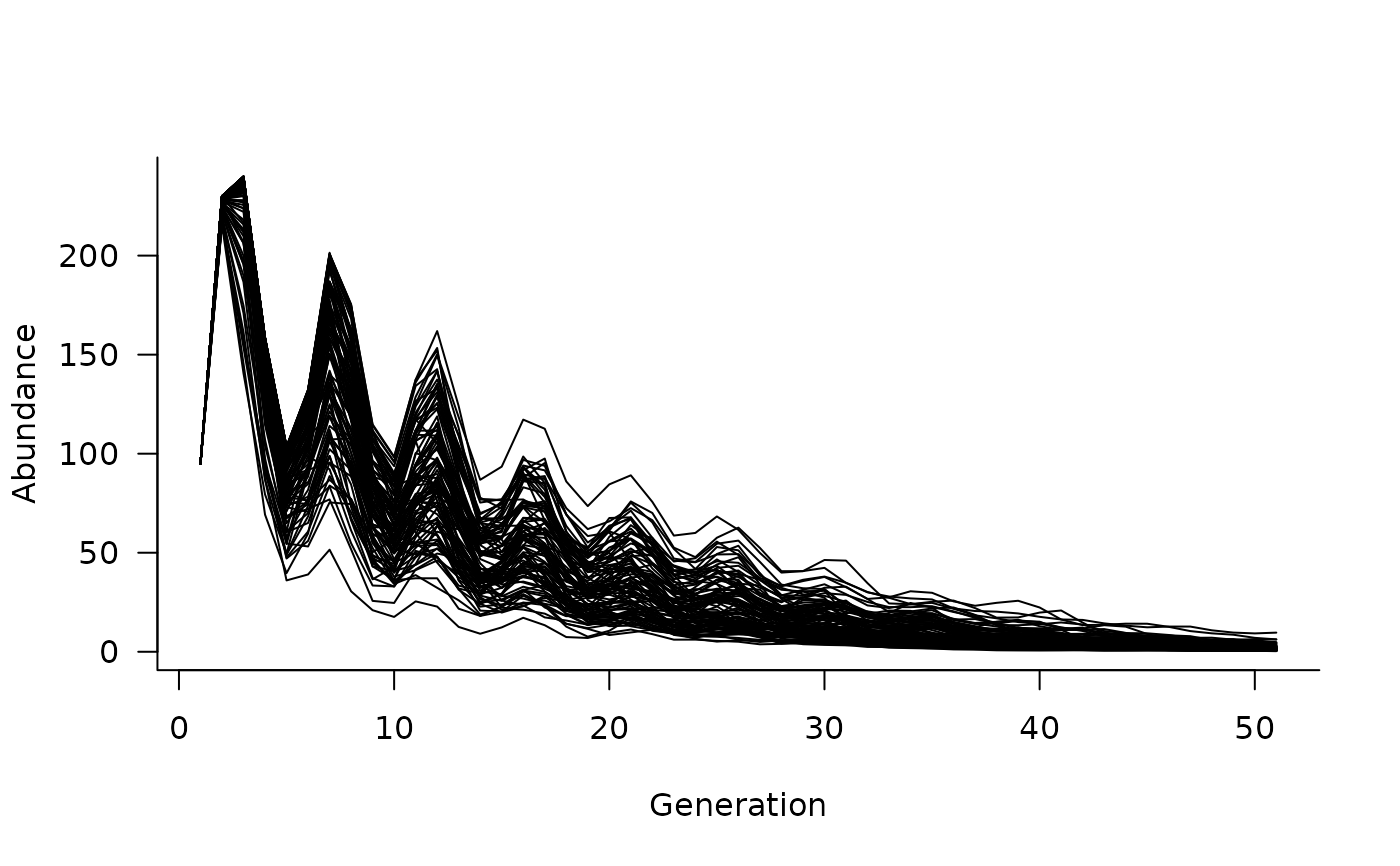
# and can plot these simulated trajectories
plot(sims)